Introduction
Portfolio strategy has taken on much greater prominence in executive suites and boardrooms. A fast changing world, shifting growth dynamics in key sectors of the economy and across regions, plus often conflicting views of value between management and investors place portfolio choices at the top of many management agendas. Increasingly, portfolio-related decisions have been “forced onto” management agendas by activist investors who often see portfolio transformation as a vehicle to unlock shareholder value. A wide cross-section of companies, many of whom are recognized leaders in their sectors including PepsiCo, Amgen, P&G, as well as leading chemical companies such as Dow and DuPont, have come under investor pressure to split up their companies or otherwise restructure their portfolios to focus on a fewer core, related businesses that together have the potential to create significant value for shareholders.
Our objective in this commentary is to provide readers with a perspective on the role of portfolio composition and structure in value creation in the chemical sector. Specifically, the central theme of this commentary is to examine “the power of portfolio focus” in contributing to superior performance in the chemical sector. We will address the following issues:
- How important is portfolio focus in creating shareholder value in the chemical sector?
- What are the advantages and/or benefits of portfolio focus?
- Should creating a tight portfolio focus be an overarching strategic goal or could its single-minded pursuit risk compromising long-term value creation in favor of short-term goals?
- What lessons can we learn from the experience of chemical companies that have actively transformed their portfolios?
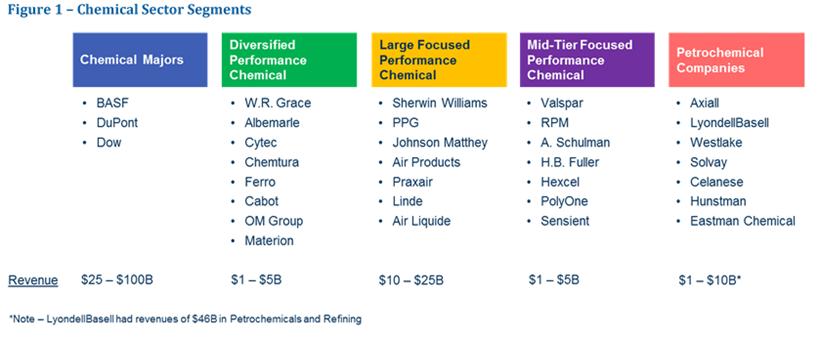
We studied 34 chemical companies and segmented them based on scale and portfolio compositions. We considered three primary dimensions in segmenting the sector:
- Mix of chemical businesses – e.g. specialty chemicals vs. chemical intermediates, and petrochemicals
- Degree of portfolio concentration – i.e. concentrated on one or two main lines of business or diversified
- Corporate scale – e.g., small/mid-sized companies with typical sales range of $2 to $5B vs. large companies with sales greater than $10B
On this basis, we broke down the industry into the following five segments illustrated in Figure 1.
We evaluated performance over three time periods: from 2007–15 representing a long term view of performance, in the economic downturn from 2008–09, and in the subsequent economic recovery and growth period from 2010–15.
Figure 1: Chemical Sector Segments
Summary Messages
We found distinct and remarkably large differences in return to shareholders between the different segments. The main findings are as follows:
- It’s all about portfolio focus – Focused companies significantly outperformed more diversified chemical companies over the 2007–15 period with a ~350 basis point difference in annual total shareholder return (TSR).
- Scale confers limited advantage – Large companies slightly outperformed small/midsized companies with a ~200 basis point difference in annual TSR over the eight-year period, but underperformed since 2010.
- Focused specialty chemical companies (both large and small) performed best – highest TSR and supporting economic metrics over the long term and since 2010.
- Chemical majors, despite scale and broadly diversified portfolios, delivered below average TSR performance.
- Petrochemical companies had leading TSR performance over the past five years– Performance was driven by advantaged feedstock prices and tight supply/demand. As expected, they performed worst in the 2008–09 economic downturn.
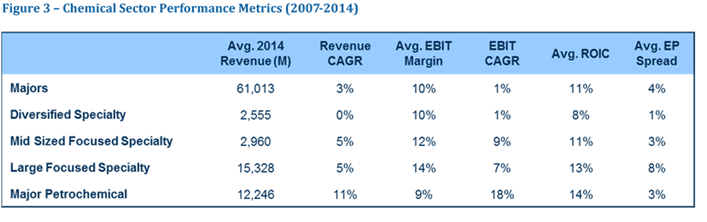
- Returns, as measured by return on invested capital (ROIC) or Economic Profit, is the primary explanation for the performance differentials between focused and diversified companies.
Findings
As can be seen in Figure 2, focused chemical companies have, as a group, outperformed diversified by a wide margin. One hundred dollars invested in market cap-weighted index of focused chemical companies on January 1, 2007 would have been worth $290 by June 1, 2015 compared to $230 for $100 invested in a diversified peer group translating into a ~350 bps TSR differential. Moreover, the average TSR of all focused chemical
Figure 2: Chemical Company TSRs
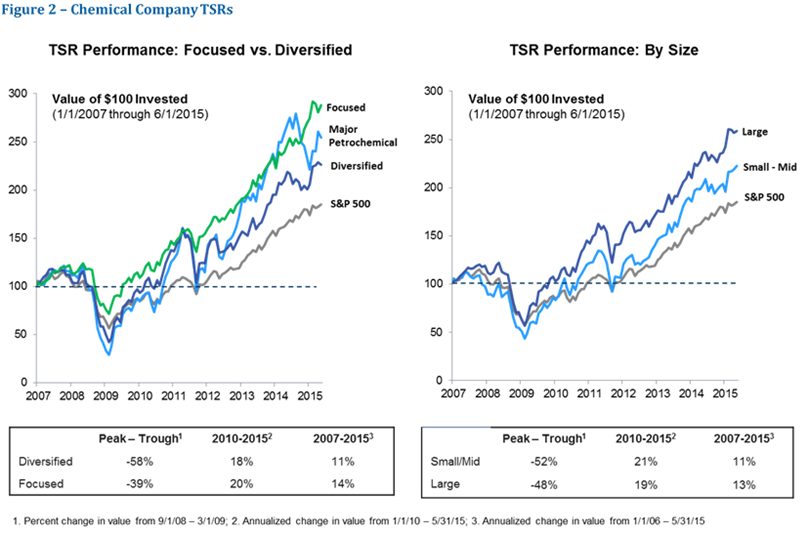
companies over this period was 14%, with virtually all companies above 11%. In contrast, diversified chemical companies’ TSRs averaged 11%, with wide variability among the companies. The weakest performing sub-segment is the small to mid-sized diversified companies. Figure 2 also illustrates that scale alone is not a material nor consistent driver of shareholder performance. The primary driver of superior performance for focused companies (both large and small) is an ROIC or EP spread (ROIC-WACC) advantage. As can be seen in Figure 3, focused specialty chemical companies outperformed diversified by 300 to 500 bps in ROIC and Economic Profit (EP = ROIC less WACC).
Why do focused companies exhibit higher returns? The primary factor, from a product / market and competitive perspective is that tightly focused companies have established leadership positions in their primary line of business. For example, the focused specialty chemical companies in our study include recognized leaders across a range of businesses including coatings, adhesives, composites, plastics, gases, and catalysts.
Underlying these leadership positions are typically cost, technology, or market related advantages vs. competitors that support higher returns.
The trade-off most often associated with focus is more limited growth potential. In other words, diversified companies should benefit from more available growth avenues. Evidence suggests that, quite the contrary, both small and large focused companies grew more rapidly than diversified. Focused companies delivered top line growth of 5% per year over the past 10 years vs. 0% for diversified. Since 2010, focused companies have also significantly outgrown diversified, 8% revenue growth for mid-sized focused specialty chemical companies vs. 2% for mid-sized diversified and 5% for majors. Clearly, divestitures associated with the restructuring activity of diversified players contributed to the lack of overall growth.
Chemical majors, as a group, outperformed their smaller diversified peers in terms of ROIC, EP, and growth. However, they were significantly outperformed by the large focused specialty chemical companies as well as petrochemical producers. The consistently weakest performing segment is small to mid-sized diversified specialty chemical companies. As a group, they delivered 5% TSRs over the period from 2007–15 and 14% over the past five years. Again, they had the lowest ROICs and virtually all the companies delivered returns below their cost-of-capital (i.e. negative EPs). With few exceptions, these companies have complex portfolios with typically four or five lines of business, positions in multiple geographies, serving numerous end markets with often quite varying needs. The result is most often high costs of customer support, product and application development, high overheads without sufficiently strong gross margins or capital efficiency to generate attractive returns. What can be observed is that these companies have generally been in a protracted period of restructuring, searching for solutions to consistent underperformance.
Figure 3: Chemical Sector Performance Metrics (2007-2014)
Lessons for Executives in the Chemical Sector
What sources of portfolio coherence can meaningfully contribute to creating value from focus? We believe the evidence points to four primary factors:
- Functional focus – common expertise in performing value-adding functions for customers that build real value added expertise (e.g. filtration, lab analytics, etc.)
- Technology focus – related technology platforms that can build linkages between different businesses
- Market focus – common end markets served that provide insight into customer needs, how best to serve customers, and to help focus new product offers and application development
- An overarching business model – a value-adding approach to managing a business that is applied across each business unit creating the benefit of scale and scope in critical management processes and a common way to add value
The common link among these four factors is that they are all fundamental business capabilities and/or processes that directly add value. In contrast, shared infrastructure, global footprint, or common back-office processes are not sufficient sources of portfolio linkage. While they create operational and overhead efficiencies, they are not the foundation of high-performing business models.
Our experience suggests that management should test its portfolio coherence against these four factors to determine whether it has the degree of relatedness that is consistent with superior performance.
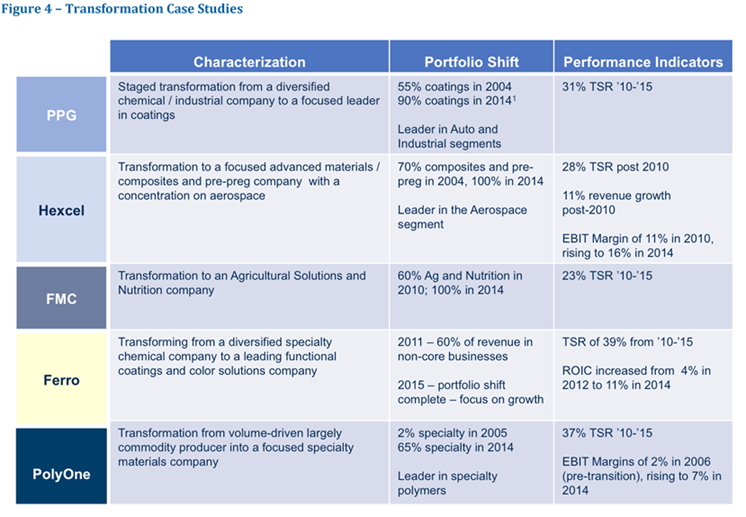
Figure 4: Transformation Case Studies
Selected Case Studies of Transformation
As expected, management in the chemical industry has moved to effect change, improve performance, and enhance shareholder value. While the change in many companies has been a series of largely incremental steps, some companies have effected broader, more holistic transformations. Figure 4 provides examples of five companies which have fundamentally transformed their portfolios. In most cases the shift was from a relatively diversified chemical company to a much more focused player. They range in size from $15B for PPG to a less than $2B company (Ferro). Despite the variation in the type of company, there are five noteworthy themes:
- Focus on fewer businesses with leadership positions – PPG for example, made a deliberate shift to become the global leader in coatings with a broad portfolio of coatings. Hexcel worked to create a leadership business in advanced materials with a specific strength serving the aerospace sector.
- Shifting from a commodity to a more specialty focus – PolyOne’s transformation largely moved it up the value-added scale from the world of commodity plastics to specialty plastics.
- Back to the core legacy businesses – Ferro and others, such as PPG, chose their legacy businesses as the renewed foundation of the company.
- Splitting up businesses with fundamentally different value drivers – FMC, for example, split out its more commodity-oriented business from its Agriculture (Ag) and Nutrition business.
- A commitment to taking tough decisions and having the “staying power” to see the change through to completion. Virtually all the transformations took place over multiple years.
What to Do
We expect the process towards creating more coherent and focused portfolios to continue. One of the main lessons of our analysis is that strength and competitive advantages in each business within a company is a critical foundation for value creation, but it is not sufficient. Management needs to actively consider and manage its portfolio to ensure it is coherent and that “the whole is worth significantly more than the sum of the parts.”
Our work suggests that management needs to actively consider several key questions to guide their priorities. These include:
- What defines the best mix of businesses for the company? Do we have a clear view of our portfolio for the future?
- Do we have a portfolio today that is sufficiently strong and coherent to support strong performance? If not, what are our options?
- How do we ensure we get the best performance and value from each business?
- How do we strike the balance between short-term pressures to restructure and potentially longer term growth and value enhancement opportunities?
Chemical industry management that does not objectively address these questions will inevitably risk external parties developing their own conclusions.