Introduction
Energy industry executives understand that conventional performance metrics derived from financial statements provide a poor representation of value creation by energy companies, particularly at the resource discovery and development step in the energy value chain. This is because most of the value is in fact created at the early stages of resource capture and exploration success and there can be a lead time in excess of ten years before cash flows become positive from a new project. Exploration accounting, whether successful efforts or full cost (sometimes followed by abrupt adjustments for impairment), does not easily translate into useful metrics at the micro level where tremendous value is created before significant capital is booked and long before revenues are
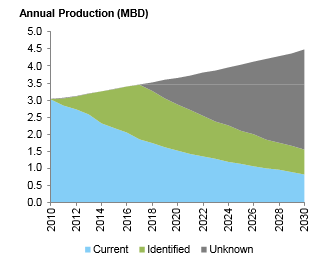
Figure 1: Typical Large Oil Company Production Profile
 As a result, there is a tendency to dismiss the whole concept of managing for value because of the vagaries of energy accounting rules. This is a mistake. At the end of the day, resource development, like any other step in the value chain, consumes capital to create value by delivering growth, returns and managing risk at the portfolio level. Indeed, explorationists are highly sophisticated in thinking about technical risk at the project and portfolio level. This sophistication continues at the corporate level in terms of sequencing projects to respect financing limits and assuring that sanctioned projects meet return thresholds, but rarely extends to a full appreciation of the risks embedded in current business sectors or how the corporate risk profile will be altered by the delivery of projects currently in the pipeline or projects that might be accessed in the more distant future.
Equally as important, most energy companies’ current resource portfolios will be largely depleted in the next fifteen years and must be replaced by a new set of resources to provide future growth and returns.
A typical production profile for a Super-major might look like Figure 1, with existing production declining at, say 6% p.a., new exploration and identified developments allowing continued production growth for the next several years, but a requirement for unknown future discoveries required to sustain production growth as these new projects themselves enter a decline phase. So the resource part of a large oil and gas company in 2030 will be largely made up of assets that have not yet entered the project pipeline. In the refining and chemicals sectors, Super-majors are divesting from unattractive markets and seeking investment opportunities in growth markets. Thus, these companies have the opportunity and challenge to reinvent themselves over the next two decades. However, the opportunity set from which this renewal will come is highly heterogeneous in terms of return and risk profile: technically, socio- politically, environmentally and in their access to attractive markets.
Further, the future external environment is highly uncertain in terms of commodity prices (direction and volatility), volumes (e.g. China and India demand growth, off-oil initiatives in developed countries, possible pro-gas policies, level of IOC access to resources, environmental opposition to resource development, protection of coal, nuclear, and renewable interests, etc.) and fiscal terms. These uncertainties affect different value chain elements differently and will profoundly impact the relative future risk and value of different corporate portfolios.
In our view, it has never been more important to engage senior executives in a deep conversation on the shape of the future portfolio that they should aim for and how they should plan to get there
Managing for Value in the Energy Industry
Experience has taught us that ‘Value’ is the best common denominator for comparing portfolio businesses, allocating resources and managing performance. This is especially true in energy given the wide range in business characteristics and performance drivers (upstream very different than midstream or downstream, risk and return very different across different segments and within segments, growth dynamics very different). Value is the only way to integrate the three major drivers: growth, profitability and risk into a single holistic approach.
We describe here two assignments that used very different approaches to achieve a single objective: a more informed and productive conversation among senior executives and Boards of Directors on the shape of the corporation in the future that addresses critical portfolio questions:
- Is it better to be diversified or a pure play?
- How much should we emphasize long lived resources such as LNG?
- Do we have the right balance between OECD and developing country opportunities?
- Should we be concerned about our deep water exploration position?
- Do we risk becoming too highly exposed to possible charges for greenhouse gas emissions?
- What level of investment in renewables makes most sense?
- Are some portfolios better equipped to survive “black swan” changes than others?
- Do we have the right balance of political and technical risks?
- Are our performance management system and decision rules aligned with our portfolio goals?
- Do we have the competencies to manage the risks we have adopted?
- Is our financial structure aligned with our portfolio risk?
- Are our strategy delivery processes aligned with value maximization?
We have seen that the analytical tools we developed for these case studies, properly tailored to suit the current businesses and cultures of our clients, enable executives to understand better and discuss with more depth of insight the options that they can access, their implications for future growth, profitability and risk, and the shareholder value that they can create. Further, the conversations naturally evolve into profound reflection on the alignment of the corporate leadership model, strategic choices and strategy delivery practices.
Case Study #1: Capturing Insights from Past Shareholder Value Creation
Our client is a large energy company with a portfolio of assets at different stages of the energy value chain with heterogeneous risk profiles. The company had suffered considerable stock market value loss during the economic crisis and at the time of our engagement was beginning to see positive signs of stock market value recovery. The corporate strategy team asked us to throw light on the reasons for the relative performance of the company and its main rivals and agreed that our framework for deconstructing value creation into its components of growth, returns and risk would be instructive.
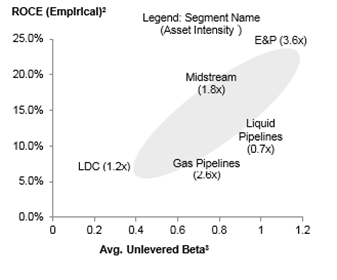
Figure 2: Segment Risk and ROCE (2007 – 2009)
Since the company’s rivals formed a rather small group, we augmented our analysis with numerous “pure plays” to understand value creation at the full portfolio and at the portfolio segment levels. We found that from 2007 through 2009, highest value was created by those companies that aggressively channeled capital into their resource development business to produce higher growth and higher returns than rivals with more conservative investment portfolios. Moreover, these companies did not necessarily show higher beta than their more conservative rivals.
But in 2010 the picture changed. Relative values of some companies that had shown good growth and returns through aggressive upstream growth had foundered while those with more conservative strategies had gained ground. The collapse in natural gas prices and expiration of price hedges had exposed risks in the upstream sector that had not been evident to investors before. The values of companies with a high proportion of oil resources vaulted over their more gassy rivals. Several upstream rivals had to dial back their growth aspirations and others did a sharp pivot from gas to oil shale plays.
Recognizing the importance of beta and the resulting corporate cost of capital to relative performance in creating value, we delved deeper into the causes of different beta values in different companies. We were able to disaggregate these causes into three categories both on a historical and on a forward looking (using volatilities derived from forward options) basis:
- Financial structure, including corporate debt to total capital ratios and use of MLPs
- Portfolio structure in terms of the half dozen industry sectors in which the full set of rivals chose to participate (Figure 2 shows the historical relationship between risk and returns for different segments)
- The competitive position of the corporation in each sector
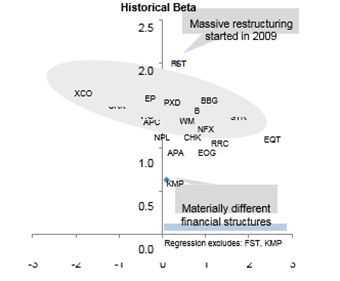
This analysis provided clear signals on the relative importance of different levers at our client’s disposal to lower its cost of capital. A similar analysis provided signals on how to improve returns. Interestingly, we discovered that from 2007-09, a strong emphasis on growth relative to returns did not necessarily result in higher beta in the upstream sector for those companies that had built strong positions in intrinsically profitable plays (Figure 3). So the caution that seems justified based on 2010 shareholder returns on the risks of upstream growth should not be interpreted too broadly.
Finally, we complemented our analysis with leadership and strategy implementation insights derived from interviews with senior executives from the group of rivals to establish a set of archetypes to seed a set of top executive and Board of Director conversations on the future shape of the corporation.
Figure 3
Beta vs. Growth/Returns Index1
Case Study #2: Visualizing the Future Portfolio
Large oil companies face enormous challenges in replacing declining base production and in providing profitable growth to deliver increasing shareholder value in the future. The larger the company, the greater is the decline that needs to be replaced and the higher is the bar to find material increments that will “move the needle” for future growth. Our client shares this challenge with other large multi-national, multi-sector oil companies. The strategy team sought our help in assessing the value implications of realizing the opportunities that had already been captured, defining the longer term portfolio options that were likely to be available and displaying their consequences for corporate growth, profitability and risk.
We agreed with our client to model annually through 2030 the evolution of the company’s current businesses and future portfolio options as a set of building blocks that could be assembled into different portfolio structures, each with distinctive characteristics of growth, profitability and risk.
To be meaningful, building blocks need to be developed that are internally homogeneous in technical capabilities required, in underlying economic drivers and in risk profiles. There was intense discussion on how many different building blocks should be modeled: there was no obvious answer that would achieve the “right” balance between sufficient granularity to seed meaningful senior level conversations and too much complexity that would obscure seeing the forest for the trees. For example, was it important to differentiate tax and royalty regimes from production sharing regimes; were there groups of countries that fell into different socio-political risk families; did all unconventional gas plays belong in Materially different financial structures Regression excludes: FST, KMP the same building block or should CBM be separated from gas shales, from tight sands? We suspect that each company will select a different set of building blocks that will best match its way of thinking about resource development opportunities.
Then each building block needs to be modeled in a way that will be credible to senior executives with deep understanding of the different plays. This required the team to model the economic profiles of the different technical plays as they were understood by the company’s operating units and choose a representation that was properly descriptive of the sort of opportunities that would be seen in the future. Numerous assumptions needed to be made about future costs for organic and inorganic growth as well as possible productivity changes and the relationship of these factors to commodity prices.
Finally, a set of assumptions were required on what is a reasonable production growth target for the firm, what is the potential resource available from each building block and what might be a maximum market share for any single company.
A base line was developed that assumed the successful delivery of resources already captured. As would be the case for most companies, these were sufficient to support production growth for the next several years. By definition, a gap emerged as soon as projects developing these resources had been ramped up and the decline of the base production again took control. The cash flow, growth, return and risk characteristics of the base line were informative and not necessarily intuitive. Alternative ways of filling this gap were modeled, and the consequences for growth, profitability and risk profiles displayed.
Our shared hope, which was in fact realized, was that the use of a transparent, simplified model would spark deep conversations at the top executive level on the options available to the corporation and their associated trade-offs on growth profitability and risk. We have been told that this initiative has changed the nature of top executive conversations about strategy and has opened up a broad reexamination of what shape portfolio the company should aspire to in the future.
Conclusions
Through these and other assignments, we have learned that managing energy portfolios for value requires a deeper consideration of growth, risk and return, and how they link to each other. The reality is that most of the value attributed to successful energy companies derives from cash flows that will occur beyond the roughly three year horizon of analyst forecasts. It is especially vital in this industry of long lead time projects that companies understand in depth the economic trade-offs of their future portfolio choices. It is also vital that they install the strategy delivery practices that will effectively manage these choices.
Note: 1) Historic beta based on weekly data between 2005 – 2009; Growth defined as E&P business segment Asset CAGR and Returns defined as ROCE (EBITDA/Assets) for 2007 – 2009; Source: Bloomberg, Capital IQ, Annual and Quarterly Reports by firm, JS Herolds, Marakon analysis